High-Precision GNSS Survey System
Published at 1/14/2026
Overview
JAHRTK2 is a dual-node GNSS system (Base + Rover) designed to bring Survey Grade Accuracy (2 cm) to affordable hardware (Quectel LC29H).
This was my first major Python project, used to learn the ecosystem while solving a complex real-world problem: accurately mapping my property and staking out site plans for buildings, driveways, and septic systems.
Technical Architecture
Unlike typical “hobbyist” setups that simply pipe NMEA data, JAHRTK2 uses a “Base-as-Service” architecture. The Base station runs 24/7 as a headless service, providing RTCM3 corrections to any connected Rover.
- Core: Python Monolith using FastAPI and Asyncio to handle high-frequency data streams.
- Infrastructure: Dockerized deployment using custom udev rules for stable hardware binding.
- Data Flow: Event-sourced messaging via in-memory queues, decoupling hardware drivers from the UI.
The “Rigorous Geodesy” Pipeline
The heart of the system is a 5-step conversion pipeline. This is critical because GPS satellites speak a different “language” than professional maps:
- The Problem: Satellites use
ITRF2020(Current Epoch), but maps useNAD83 (2011). Tectonic drift creates a ~40cm discrepancy. - The Solution:
- ECEF Conversion: Linear Cartesian math to avoid spherical distortion.
- Epoch Rewinding: Using PROJ to shift coordinates back to
2010.0. - Orthometric Projection: Applying Geoid18 for accurate sea-level heights.
- Statistical Verification: ISO 17123-8 standard validation using 3-Sigma filtering.
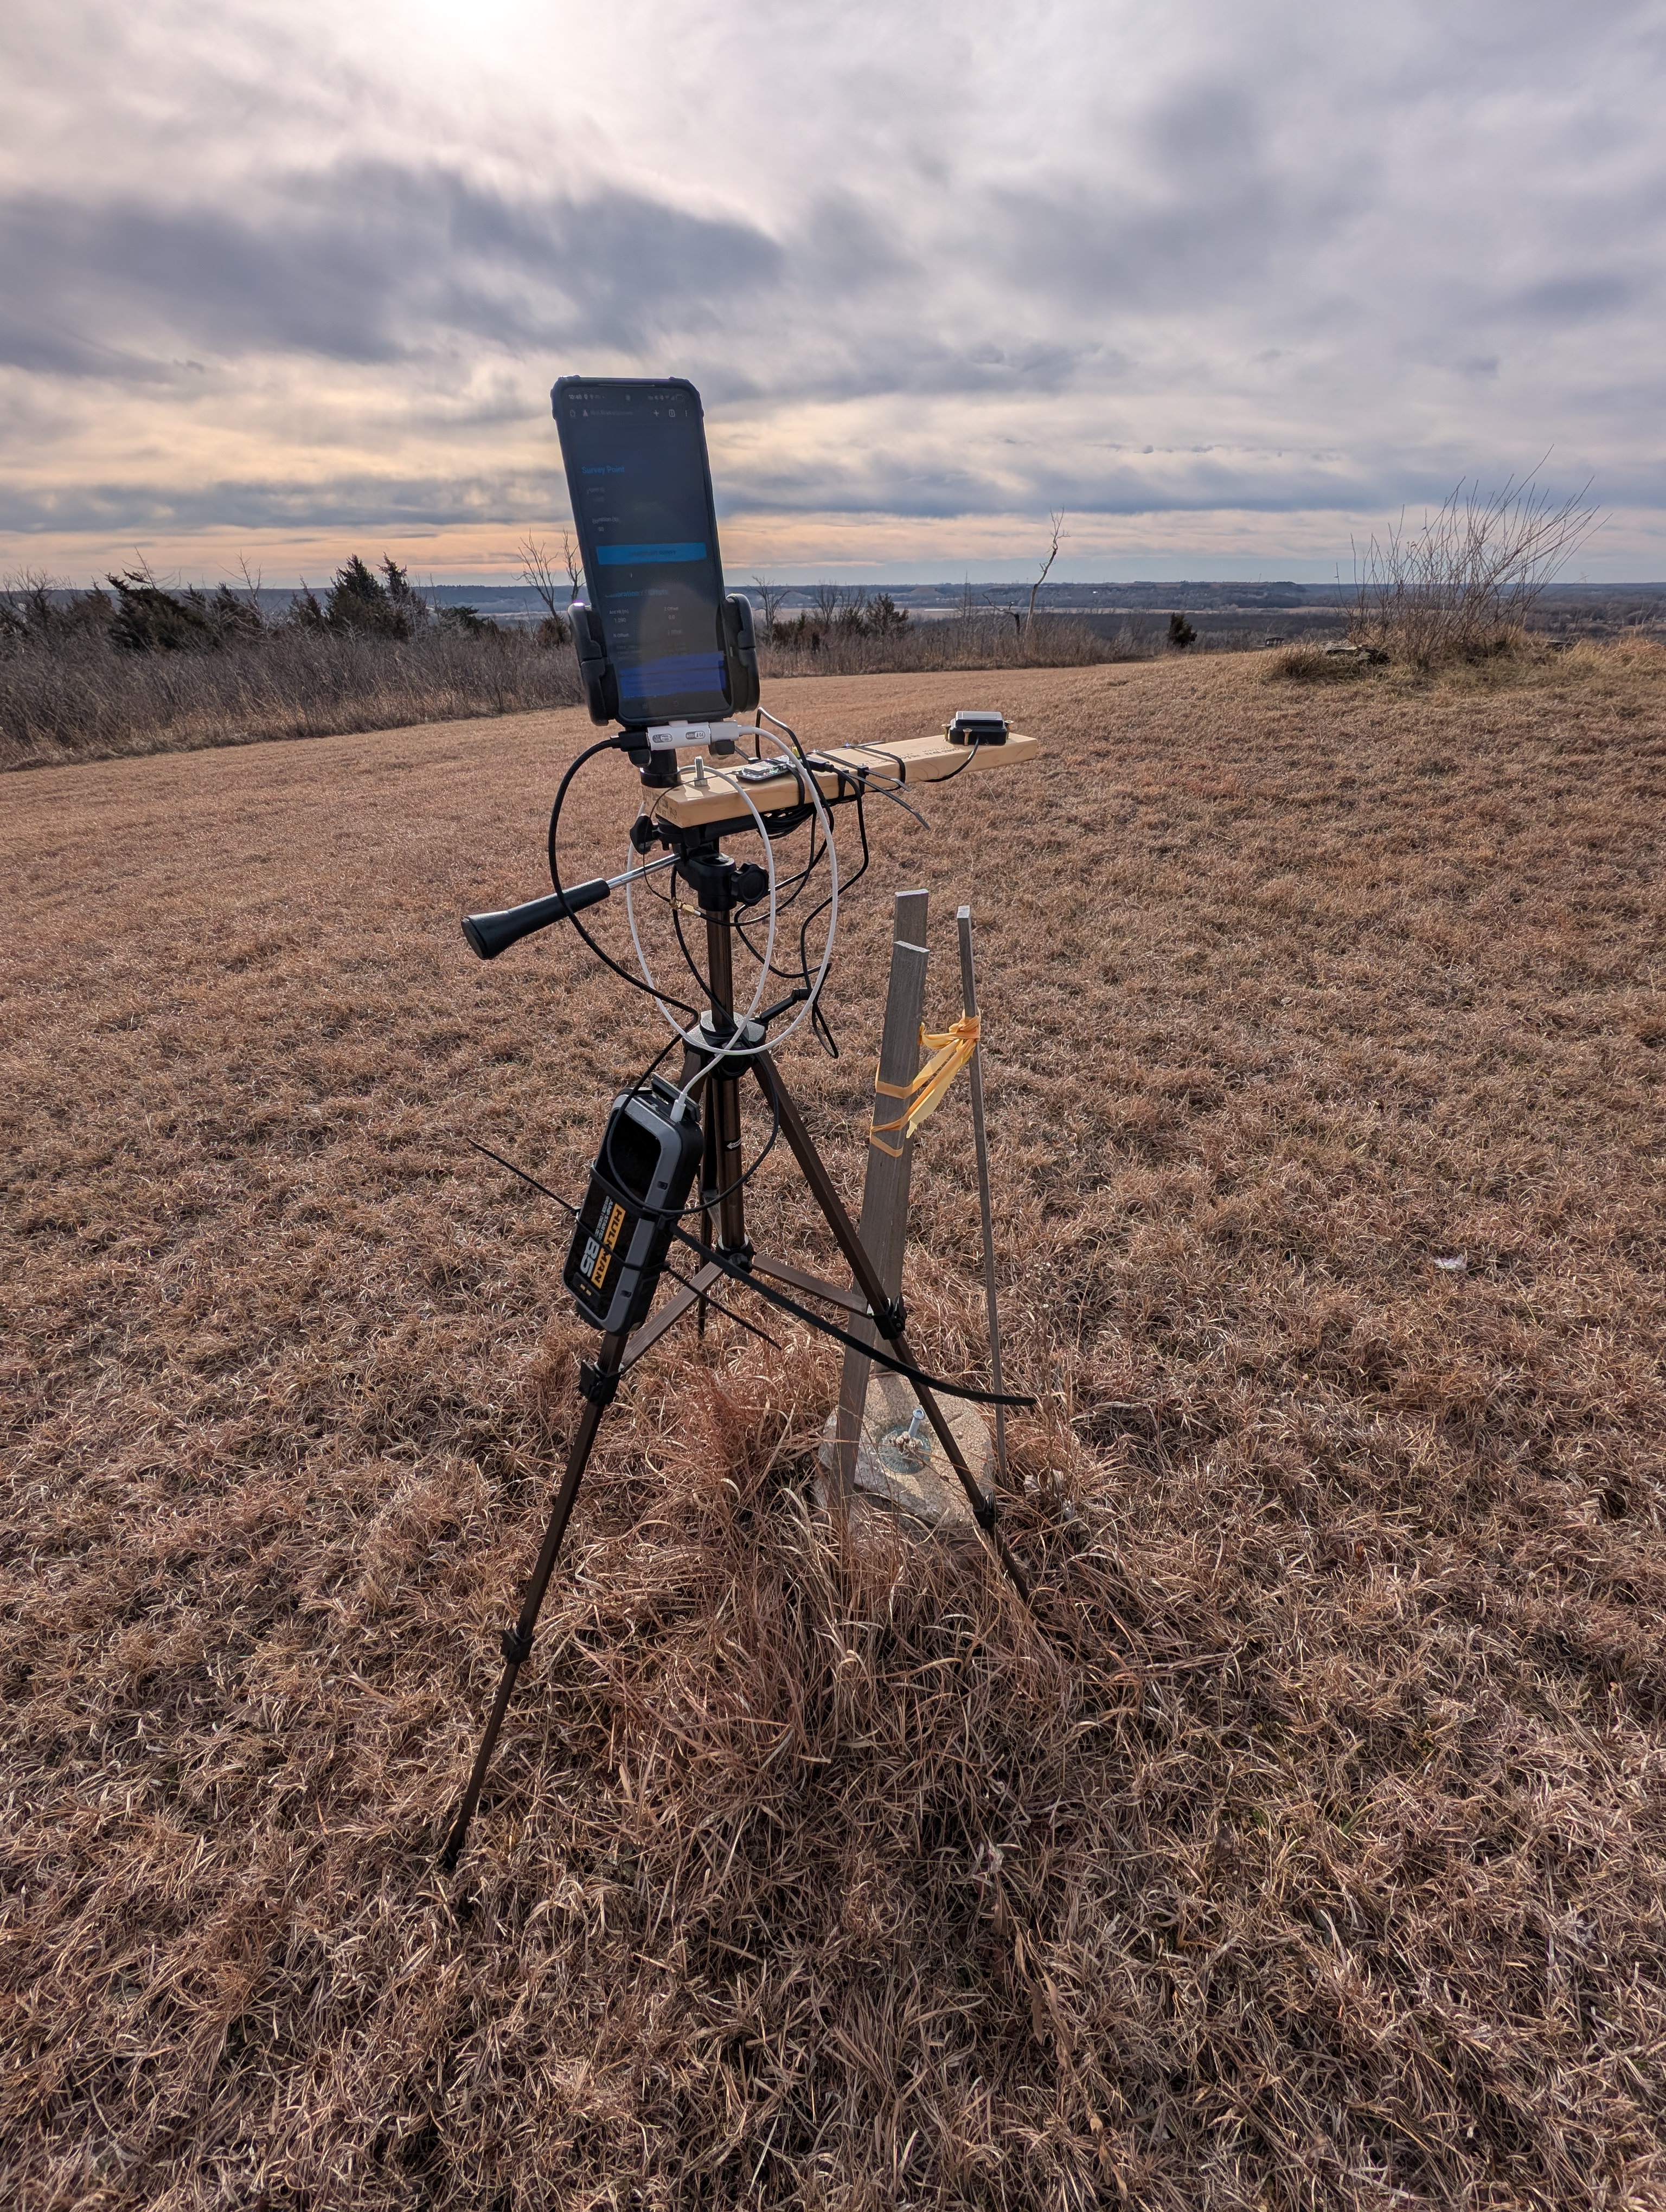
Operational Reality
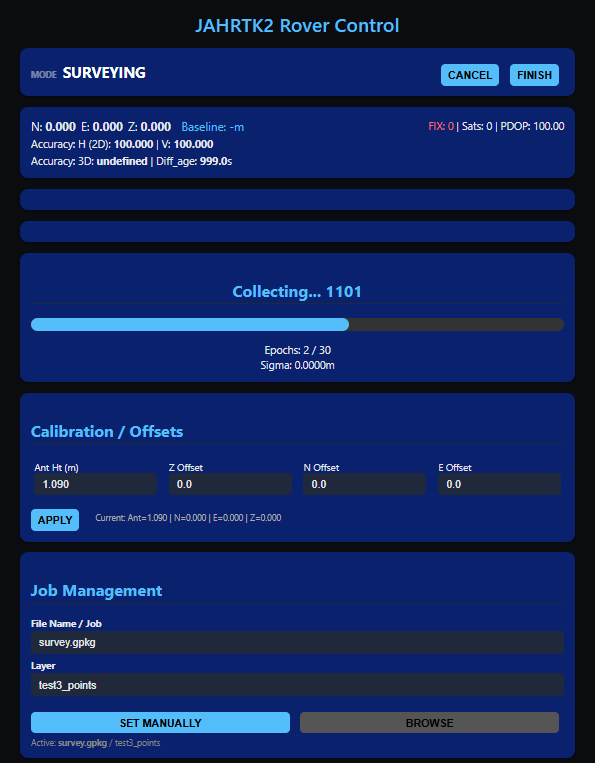
The entire system is operated via a responsive web interface, allowing for real-time operation from multiple mobile devices or laptops while in the field.

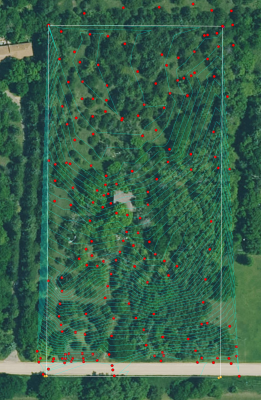
Below is an example of mapping information created using this system in QGIS. Each red dot represents a collected point; these were used to generate the blue 1-ft elevation contour lines, helping to visualize the area’s topography.

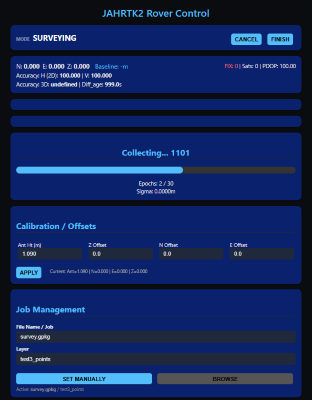
Navigation Mode
Navigation mode allows the user to navigate to a specific point, line, or area, so that features designed in GIS software can be accurately staked out in the field.
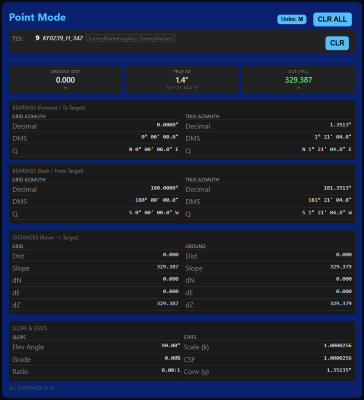
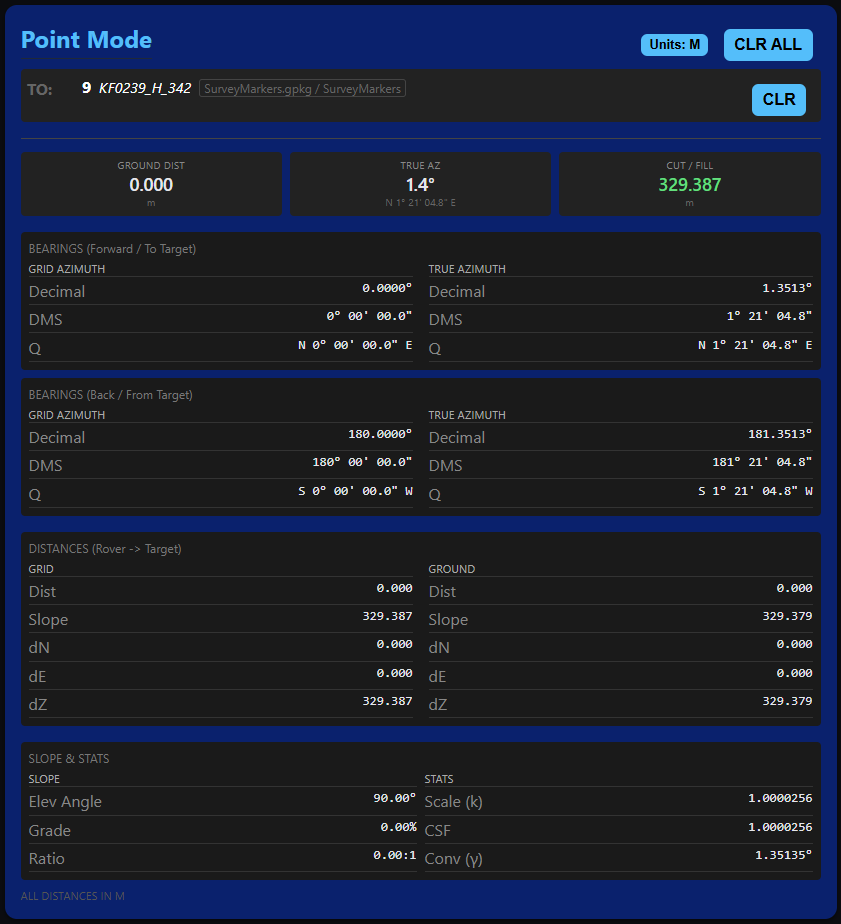
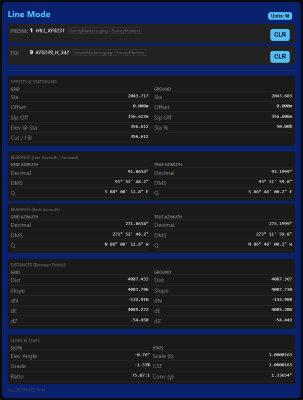
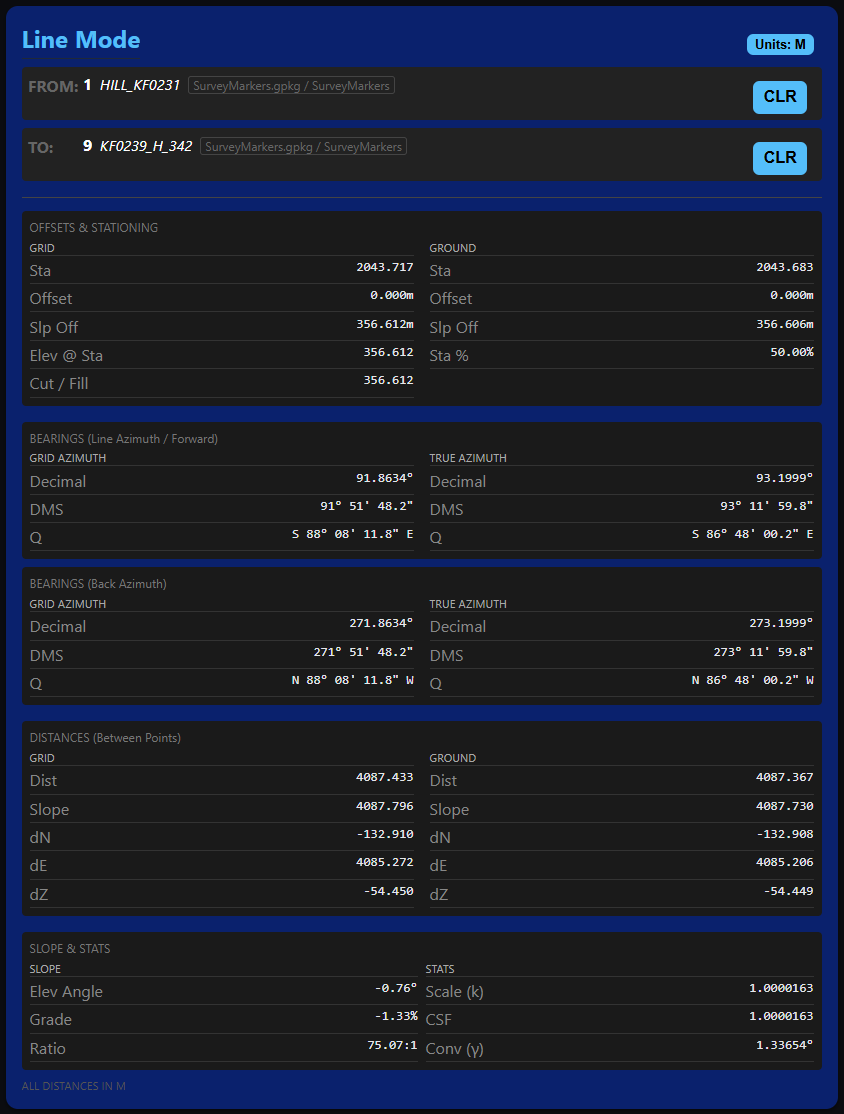
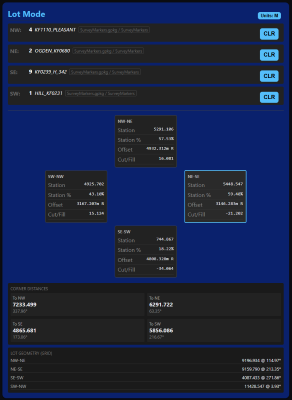
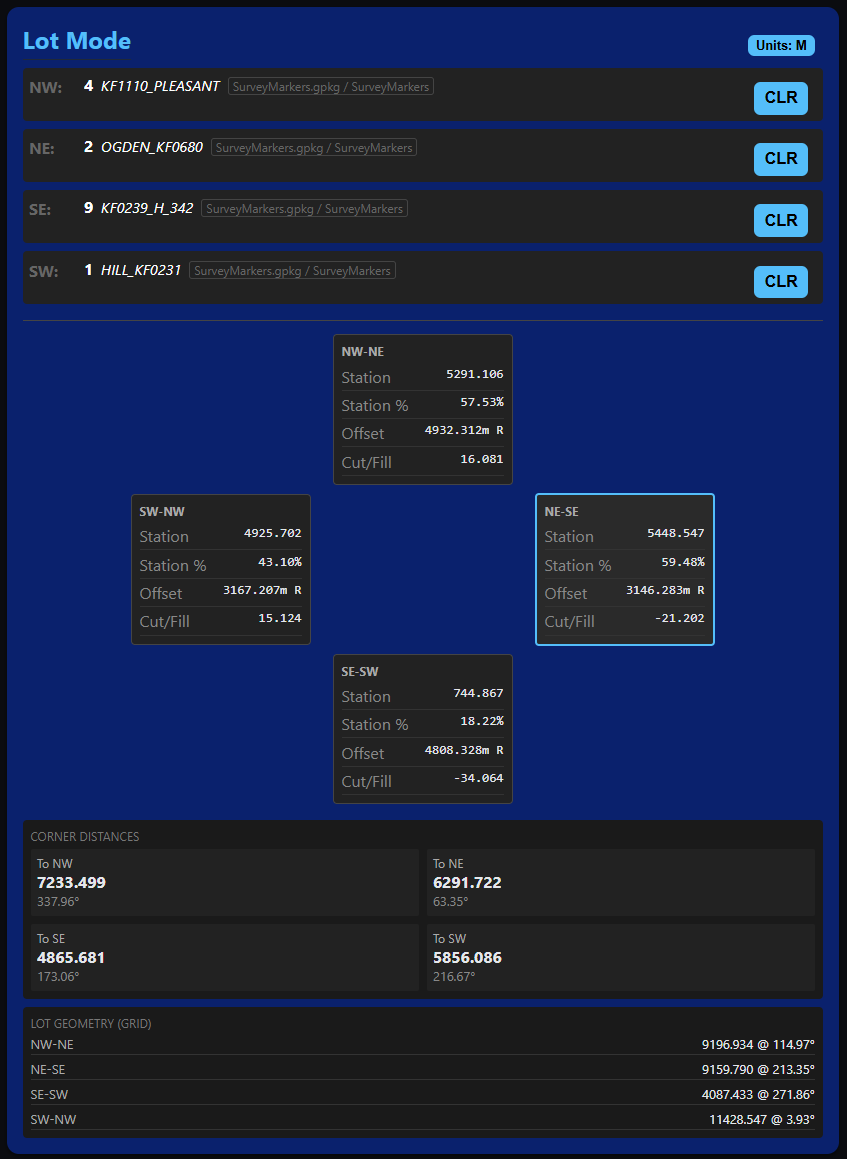
Three different navigation modes to help go from GIS software to field layouts.
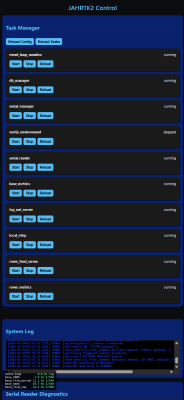
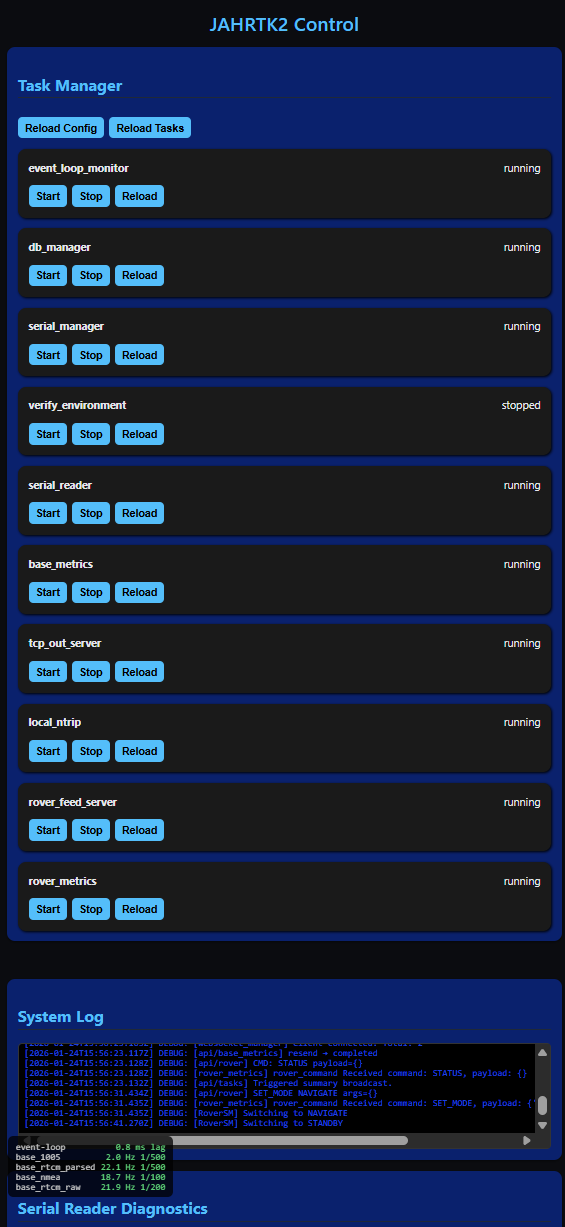
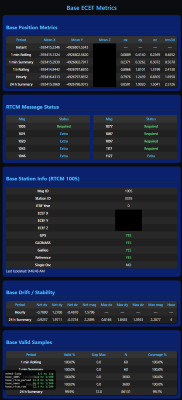
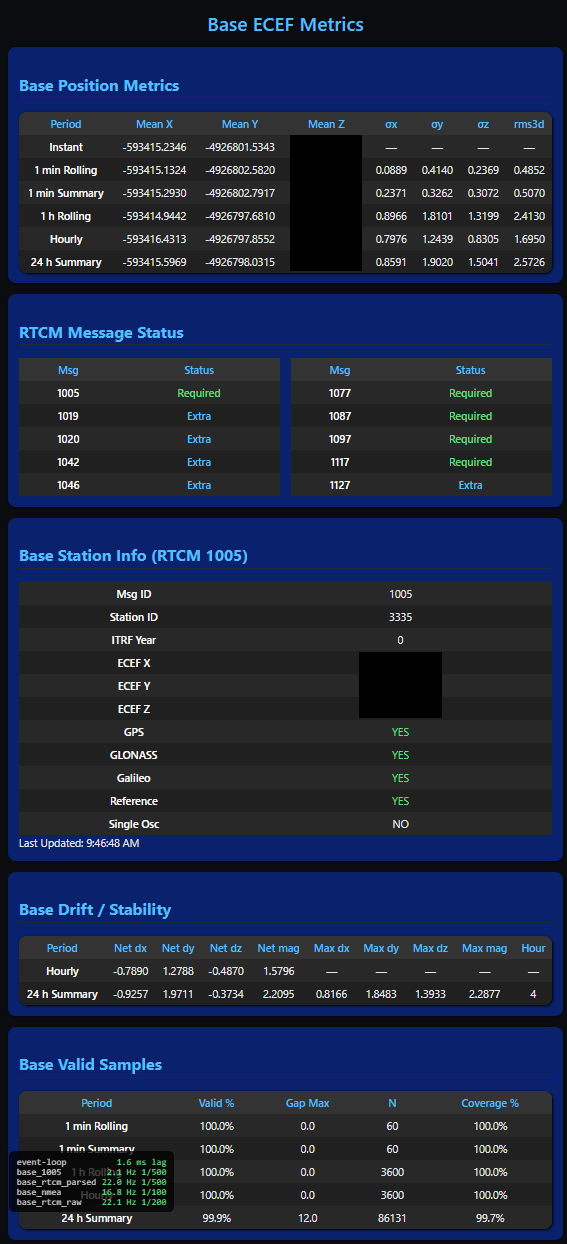
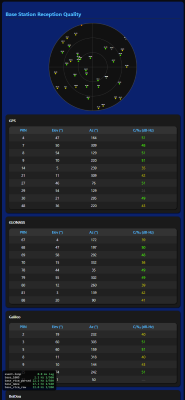
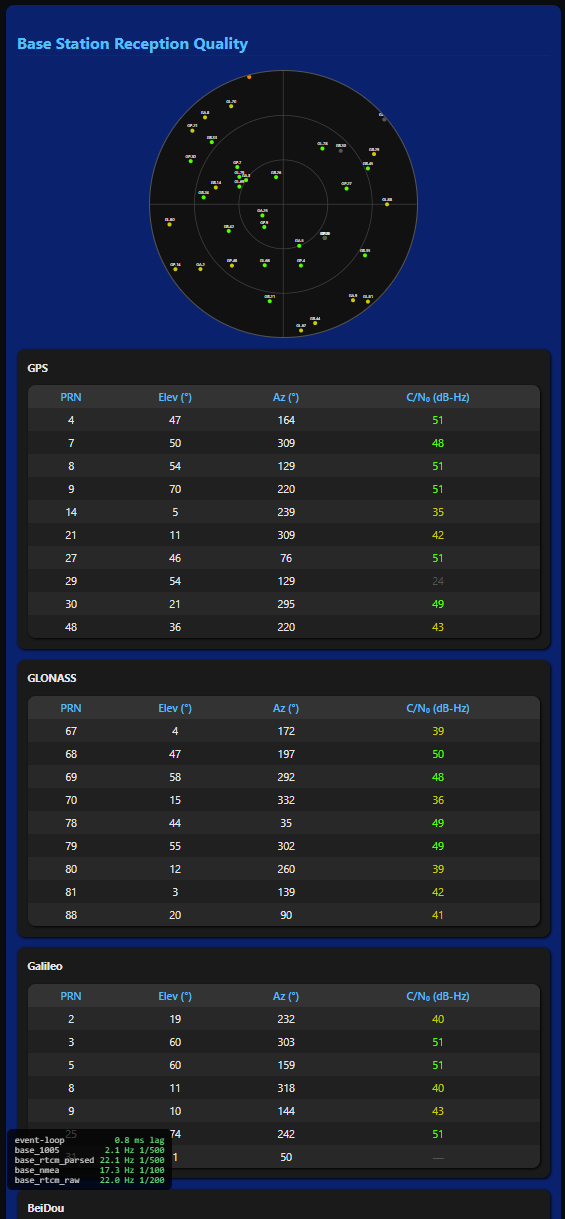
Base Station Monitoring
The base station UI provides a dashboard of real-time statistics to be able to visually confirm the stability of the base station.
Complexity & Challenges
- Concurrency: Overcoming GIL limitations and asyncio loop starvation to ensure millisecond-precise processing of 10Hz GNSS frames.
- Traceability: Every point carries a “Geodetic Receipt”—a raw log of the ECEF vectors and base stability at the time of capture, allowing for forensic verification years later.
- Reliability: Implemented a “Hot-Reload” task manager that allows individual hardware drivers to restart without interrupting the web server or active telemetry.